Fitbit steps: an end-to-end data engineering project
Introduction
I’ve been paying more attention to health metrics from my Fitbit tracker lately, and it occurred to me that building a data engineering pipeline to visualize them could be a neat little project (and an excuse to try out new tech 😎). So, let’s implement a pipeline that extracts, loads, transforms, and visualizes Fitbit data. For simplicity, in this post, we’ll only focus on step data.
Here’s how the pipeline is going to look:
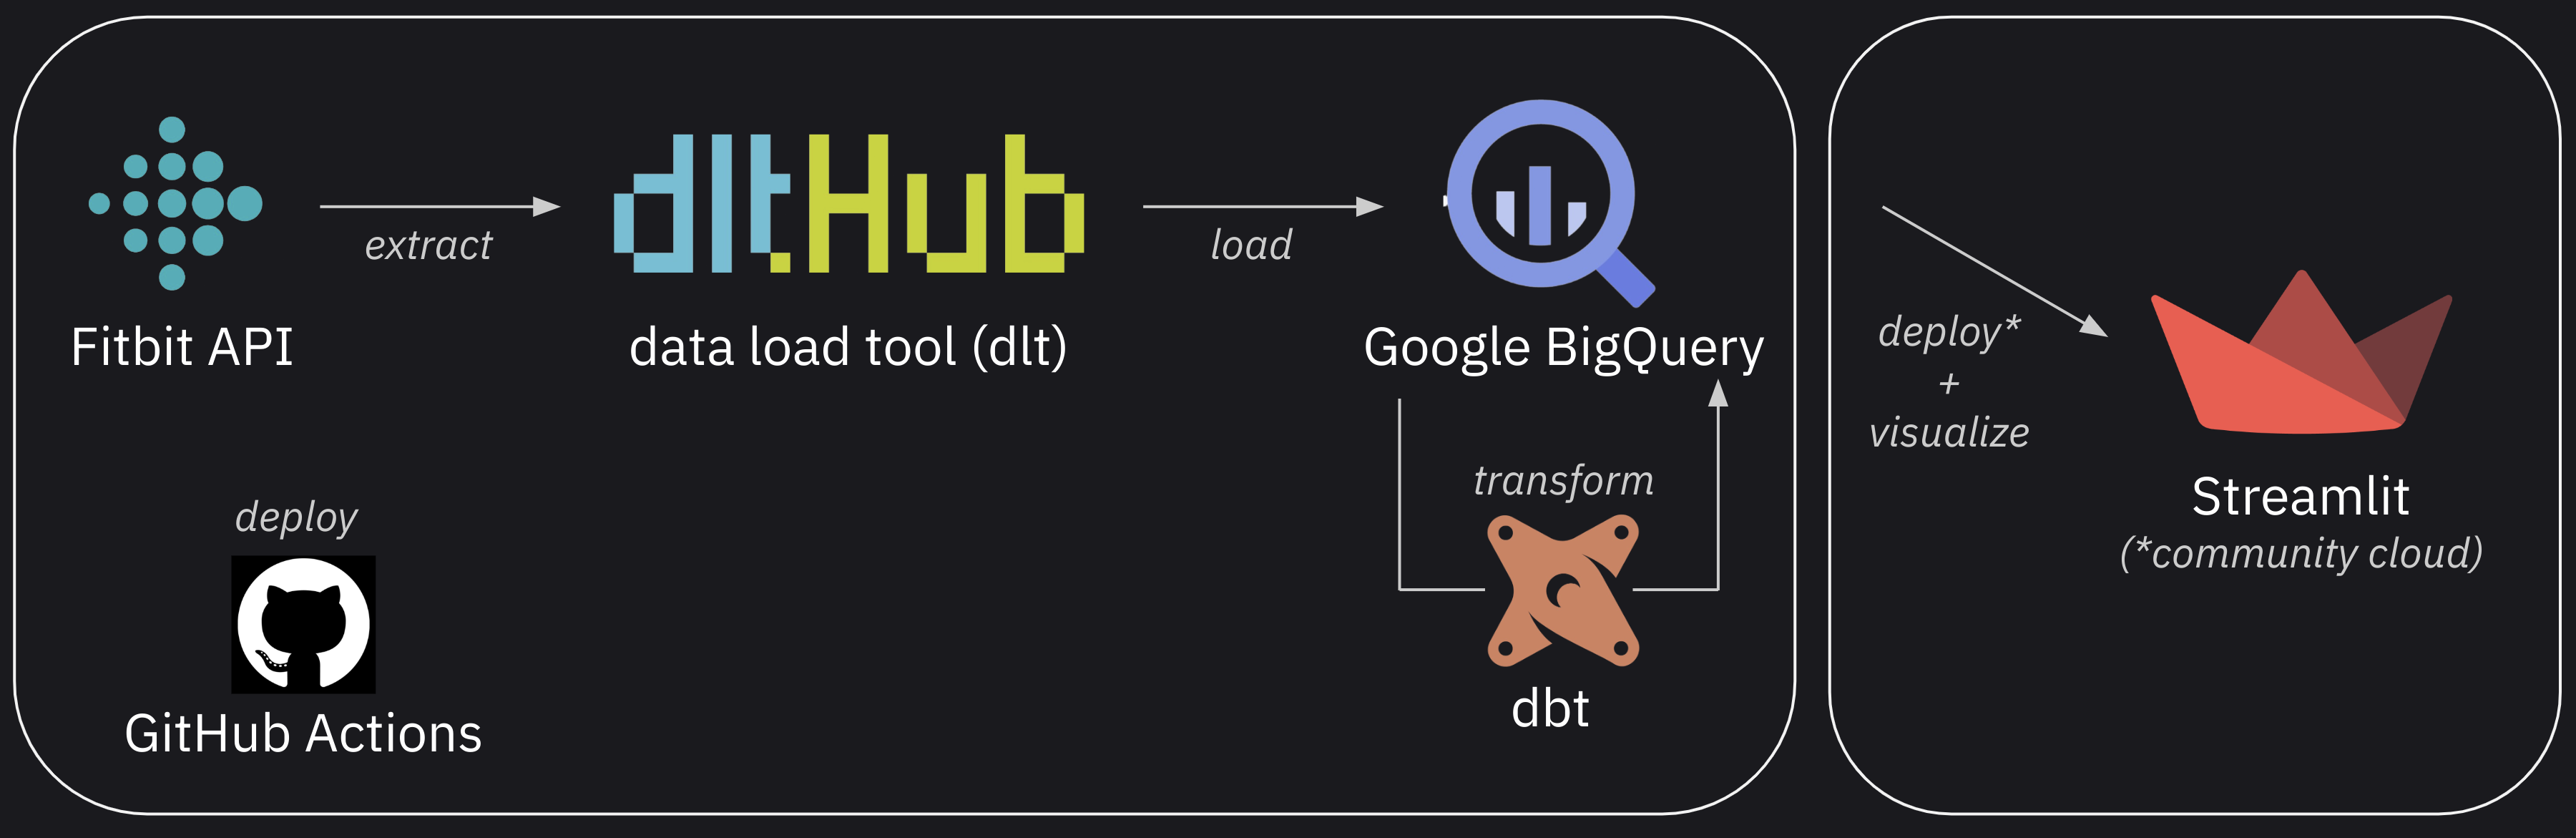 Data pipeline
First, we’ll extract data from the Fitbit Web API and load it into BigQuery using dlt. Then, we transform the data using dbt and visualize it using Streamlit. We’ll automate deployment with GitHub Actions and host the dashboard on Streamlit Community Cloud.
Here’s the final dashboard and GitHub repository implementing all the above.
Authentication
If you decide to clone/fork fnery/fitbit-steps and want to try this pipeline yourself, follow the next couple of sections which go through the process of authenticating with the services we’ll use.
We’ll create files containing sensitive information and store them locally. I’ve added all these to a .gitignore file (here) to avoid accidentally pushing them to a GitHub repo.
Fitbit Web API
Follow these docs to get started with the Fitbit APIs. This involves creating an account, registering an application, and authorizing access to user data (see this OAuth 2.0 tutorial).
Once you have a Fitbit access token, create an .env file in the root of the repository and assign the token value to a FITBIT_ACCESS_TOKEN variable:
1
FITBIT_ACCESS_TOKEN=eyJ...
Google BigQuery
Create a new Google Cloud project and ensure the BigQuery API is enabled. Then, create a service account and assign it the following roles (as specified in the dlt docs):
- BigQuery Data Editor
- BigQuery Job User
- BigQuery Read Session User
Finally, create access credentials for the service account. This process will generate a JSON file which you must store at the root of the repository and rename it to GCLOUD_SERVICE_ACCOUNT_KEY_FILE.json.
To avoid authentication issues, ensure the service account JSON file is renamed exactly to
GCLOUD_SERVICE_ACCOUNT_KEY_FILE.jsonand is stored at the root of the repository.
Streamlit
Follow these docs to create a .streamlit/secrets.toml and populate it with the data from the GCLOUD_SERVICE_ACCOUNT_KEY_FILE.json service account key file. This will allow our Streamlit app to read data from BigQuery.
GitHub Actions workflow
The main focus of this post is to demonstrate the integration of various tools and technologies to create a seamless data workflow. The center point for all this is this GitHub Actions workflow file. Let’s break it down.
First, we name the workflow and define its trigger. We set a cron job so that it runs every two hours. We also want to be able to trigger the workflow manually (e.g. on the GitHub UI) to test changes immediately after modifying it, so we set the workflow_dispatch: null key-value pair.
1
2
3
4
5
6
name: Run Fitbit steps pipeline

on:
  schedule:
    - cron: '0 */2 * * *'
  workflow_dispatch: null
We need to provide the workflow with access to the same sensitive configuration settings we have stored locally (see the Authentication section). We’ll source these from GitHub secrets to pass them securely to the workflow.
1
2
3
4
env:
  GCLOUD_SERVICE_ACCOUNT_KEY_FILE: ${{ secrets.GCLOUD_SERVICE_ACCOUNT_KEY_FILE }}
  DESTINATION__BIGQUERY__LOCATION: ${{ secrets.DESTINATION__BIGQUERY__LOCATION }}
  FITBIT_ACCESS_TOKEN: ${{ secrets.FITBIT_ACCESS_TOKEN }}
You’ll need to create these secrets in your GitHub repository by going to Settings > Secrets and variables > Actions and click “New repository secret”.
Next, we’ll define the two workflow jobs: maybe_skip and run_pipeline.
The first, maybe_skip, uses the fkirc/skip-duplicate-actions@v5 action to check for duplicate workflows and potentially skip the current one if there is a concurrent or recent successful duplicate workflow running.
1
2
3
4
5
6
7
8
9
10
11
12
jobs:
  maybe_skip:
    runs-on: ubuntu-latest
    outputs:
      should_skip: ${{ steps.skip_check.outputs.should_skip }}
    steps:
      - id: skip_check
        uses: fkirc/skip-duplicate-actions@v5
        with:
          concurrent_skipping: always
          skip_after_successful_duplicate: 'false'
          do_not_skip: '[]'
Then, we start the run_pipeline job if maybe_skip.outputs.should_skip is not true. If that’s the case, we start by checking out the repository code.
1
2
3
4
5
6
7
run_pipeline:
  needs: maybe_skip
  if: needs.maybe_skip.outputs.should_skip != 'true'
  runs-on: ubuntu-latest
  steps:
    - name: Check out code
      uses: actions/checkout@v3
Then, we create a JSON file with the contents of the GCLOUD_SERVICE_ACCOUNT_KEY_FILE secret and set its path to an environment variable.
1
2
3
4
5
- name: Create gcloud service account file and set its path to an environment variable
  run: |
    GCLOUD_SERVICE_ACCOUNT_KEY_FILE_PATH=$(pwd)/gcloud_service_account_key_file.json
    echo "$GCLOUD_SERVICE_ACCOUNT_KEY_FILE" > $GCLOUD_SERVICE_ACCOUNT_KEY_FILE_PATH
    echo "GCLOUD_SERVICE_ACCOUNT_KEY_FILE_PATH=$GCLOUD_SERVICE_ACCOUNT_KEY_FILE_PATH" >> $GITHUB_ENV
Then, we set up Python 3.10 and install the dependencies listed on requirements.txt. If either a cached virtual environment or pip download cache are available from previous runs, they are used to speed up workflow execution.
1
2
3
4
5
6
7
8
9
10
11
12
13
14
15
16
17
18
- name: Setup Python
  uses: actions/setup-python@v4
  with:
    python-version: 3.10.x

- name: Restore virtual environment from cache
  uses: syphar/restore-virtualenv@v1
  id: cache-virtualenv
  with:
    requirement_files: requirements.txt

- name: Restore pip download cache
  uses: syphar/restore-pip-download-cache@v1
  if: steps.cache-virtualenv.outputs.cache-hit != 'true'

- name: Install python dependencies
  run: pip install -r requirements.txt
  if: steps.cache-virtualenv.outputs.cache-hit != 'true'
The next step runs the ingest.py script to extract data from the Fitbit API and load it into BigQuery.
1
2
3
4
- name: Extract data from Fitbit API and load to BigQuery
  run: |
    export GOOGLE_APPLICATION_CREDENTIALS=${{ env.GCLOUD_SERVICE_ACCOUNT_KEY_FILE_PATH }}
    python 'ingest.py'
Finally, we compile and run the dbt project to transform the data:
1
2
3
4
5
6
7
- name: Compile dbt project
  run: dbt compile --profiles-dir . --target prod
  working-directory: transform

- name: Run dbt project
  run: dbt run --profiles-dir . --target prod
  working-directory: transform
Having reviewed what the pipeline consists of and how it runs, let’s now provide additional context on the individual steps.
Checking out the Fitbit Web API
For the purposes of this project, all we need is a simple endpoint providing the total step count on a daily basis. Below is an example request to the endpoint we will use to inspect the structure of the data responses:
1
2
3
4
5
6
7
8
9
10
11
12
13
14
15
curl -sX GET "https://api.fitbit.com/1/user/-/activities/steps/date/2024-05-13/2024-05-14.json" \
  -H "accept: application/json" \
  -H "authorization: Bearer $FITBIT_ACCESS_TOKEN" | jq .
# {
#   "activities-steps": [
#     {
#       "dateTime": "2024-05-13",
#       "value": "13469"
#     },
#     {
#       "dateTime": "2024-05-14",
#       "value": "20657"
#     }
#   ]
# }
Note that for the above to work, I have
FITBIT_ACCESS_TOKENinitialized as an environment variable.
Extracting/loading data into BigQuery
It would be trivial to write a custom Python script to load data from such a simple data source. Nevertheless, having recently discovered the dlt open-source tool (which being Python library makes easy to integrate into our workflow), I decided to give it a try.
Our python script, ingest.py, requires 2 environment variables, FITBIT_ACCESS_TOKEN and GOOGLE_APPLICATION_CREDENTIALS (the path to the service account JSON file). As we saw above, when executing the script as part of a GitHub action, these are sourced from GitHub repository secrets. When running locally, they will be loaded as follows:
1
2
3
4
# Setup local environment variables if not running in GitHub Actions
if not os.getenv('GITHUB_ACTIONS') == 'true':
    load_dotenv()
    os.environ["GOOGLE_APPLICATION_CREDENTIALS"] = '../GCLOUD_SERVICE_ACCOUNT_KEY_FILE.json'
We’re then able to request the Fitbit data from the API using a standard approach:
1
2
3
4
5
6
7
8
9
10
def fetch_fitbit_data(start_date, end_date):
    """Fetch data from Fitbit API."""
    url = f"{FITBIT_API_URL}/{start_date.strftime('%Y-%m-%d')}/{end_date.strftime('%Y-%m-%d')}.json"
    headers = {
        'accept': 'application/json',
        'authorization': f'Bearer {os.getenv("FITBIT_ACCESS_TOKEN")}'
    }
    response = requests.get(url, headers=headers)
    response.raise_for_status()
    return response.json()['activities-steps']
This returns a list of dictionaries that can be passed directly to dlt:
1
2
3
4
5
6
7
8
9
10
11
pipeline = dlt.pipeline(
    pipeline_name="steps_pipeline",
    destination="bigquery",
    dataset_name=DATASET_NAME,
)
load_info = pipeline.run(
    data,
    table_name=TABLE_NAME,
    write_disposition="merge",
    primary_key="date_time"
)
After running ingest.py we’re able to query data on BigQuery. An option is to use the bq command line tool:
1
2
3
4
5
6
7
8
9
10
bq query --nouse_legacy_sql 'SELECT * FROM `dlt-bq-test.fitbit_ingest.steps` ORDER BY date_time DESC LIMIT 5'
# +------------+-------+--------------------+----------------+
# | date_time  | value |    _dlt_load_id    |    _dlt_id     |
# +------------+-------+--------------------+----------------+
# | 2024-05-15 | 3436  | 1715786904.9847844 | gSJ0BcXZ7fVspg |
# | 2024-05-14 | 20657 | 1715786904.9847844 | ssQh5QhKk/jzKA |
# | 2024-05-13 | 13469 | 1715732009.5069923 | 4rdFaaQmKOY2Rw |
# | 2024-05-12 | 12327 | 1715699062.0484285 | 95vXeGnqnXXDCA |
# | 2024-05-11 | 14377 | 1715699062.0484285 | 6NZfKPSyxBKTqQ |
# +------------+-------+--------------------+----------------+
Where dlt-bq-test is the ID of my particular Google Cloud project.
Other things worth noting from ingest.py:
- Data ingestion starts from
START_DATE = "2024-01-02 - We only extract the full data history on the first run. Subsequent runs extract data from the current and the previous day.
- Duplicates are prevented by the combination of
write_disposition="merge"andprimary_key="date_time"
Transforming data with dbt
We’re interested in daily step count data and this is precisely what we get from the API and have available in our data warehouse as a result of the ingestion process, so there’s little we need to do as far as data transformations are concerned. Nevertheless, we include a transformation step to demonstrate how dbt can be used to transform the data.
Initializing a dbt project (dbt init) in the transform directory results in the standard “dbt project” structure you see in the repo. One of these directories, models contains the dbt SQL file fct_steps.sql which defines the single data model where the original date and step count columns are renamed and recasted. After an initial run, subsequent runs are incremental, merging incoming step data into the existing table, only processing records with a date equal or later than the most recent day already in the table.
1
2
3
4
5
6
7
8
9
10
bq query --nouse_legacy_sql 'SELECT * FROM `dlt-bq-test.fitbit_transform.fct_steps` ORDER BY day DESC LIMIT 5'
# +------------+-------+---------------------+
# |    day     | steps |   transformed_at    |
# +------------+-------+---------------------+
# | 2024-05-15 |  5918 | 2024-05-15 20:54:01 |
# | 2024-05-14 | 20657 | 2024-05-15 20:54:01 |
# | 2024-05-13 | 13469 | 2024-05-14 15:04:58 |
# | 2024-05-12 | 12327 | 2024-05-14 15:04:58 |
# | 2024-05-11 | 14377 | 2024-05-14 15:04:58 |
# +------------+-------+---------------------+
Visualizing data with Streamlit
Having our data ready, the goals now are:
- Go from data to dashboard as quickly and effortlessly as possible
- Keep the dashboards alive (refreshing at a similar frequency as the underlying data models)
- Make the dashboards easily shareable
- Build the dashboards in a programmatic way (no WYSIWYG tools)
With this in mind, I decided to use Streamlit, a library that enables building dashboards in the form of web apps using Python without requiring any frontend knowledge. Furthermore, their Community Cloud service makes it easy (and free) to deploy and share the resulting dashboards. Streamlit is one of several emerging BI-as-code tools1 which enable the use of software engineering best practices (version control, CI/CD, dev/prod environments, etc) to the construction of reports/dashboards.
Here’s the resulting script: visualize.py2. Assuming you followed the Authentication section and ran prior ingestion and transformation steps, you should be able to run it locally with:
1
streamlit run visualize.py
To deploy it to the Streamlit Community Cloud, follow these docs. Note you’ll have to provide the contents of .streamlit/secrets.toml by going to “Advanced settings” in the “Deploy an app” page.
At the time of writing, here’s a preview of how the app looks:
This seems like a good place to end this post! While there’s a lot we can do to improve this project3, we’ve successfully achieved our primary goal: building a data pipeline from scratch that extracts, loads, transforms, and visualizes data. Plus, we’ve automated the process to ensure our dashboard is consistently refreshed on schedule.
If you guessed an LLM built this script, you’re right. Thanks ChatGPT! I strongly encourage anyone to experiment with LLMs for these kinds of simple, well-defined tasks. ↩
Containerize the entire pipeline using Docker, add data quality checks (e.g., dbt tests), expand data sources and process the additional data for better insights, set up monitoring/alerting, transition from cron jobs to dedicated orchestration tools like Airflow or Dagster (if and when the increase in complexity is warranted), etc. ↩